


This article is part of our Rounding Third series.
In two of the last three seasons, I've attempted to find targets for each 5x5 category for hitting and pitching for 15-team and 12-team mixed leagues, using data from the NFBC platform, taken from the 15-team Main Event, 15-team TGFBI contest and the 12-team RotoWire Online Championship. While I think that the results are interesting, they're necessarily backwards looking, unless you have inside knowledge on what the league is doing with the baseball. Nonetheless, I think this exercise helps give us a general idea of what we need to compete in each category, and to see the yearly trends. I didn't write this article after last season, because of the 60-game season with the imbalanced schedule. We didn't have the usual ebbs and flows of a season, players able to recover from slow starts and others crashing back to earth. I don't think that the titles won by competitors in 2020 should be diminished, but I question the probative value of the overall 2020 results.
We'll start off with the hitting category targets this week, and then move on to the pitchers next week. My first reaction to the results was astonishment in how far the numbers were down, but then with another look, I remembered just how much hitting was up in 2019 with the Happy Fun Ball. We have to remember that 2019 was not merely a prolific hitting season, but a record-setting, off-the-charts power season. Take a look at the league-wide stats since 2015 to see just
In two of the last three seasons, I've attempted to find targets for each 5x5 category for hitting and pitching for 15-team and 12-team mixed leagues, using data from the NFBC platform, taken from the 15-team Main Event, 15-team TGFBI contest and the 12-team RotoWire Online Championship. While I think that the results are interesting, they're necessarily backwards looking, unless you have inside knowledge on what the league is doing with the baseball. Nonetheless, I think this exercise helps give us a general idea of what we need to compete in each category, and to see the yearly trends. I didn't write this article after last season, because of the 60-game season with the imbalanced schedule. We didn't have the usual ebbs and flows of a season, players able to recover from slow starts and others crashing back to earth. I don't think that the titles won by competitors in 2020 should be diminished, but I question the probative value of the overall 2020 results.
We'll start off with the hitting category targets this week, and then move on to the pitchers next week. My first reaction to the results was astonishment in how far the numbers were down, but then with another look, I remembered just how much hitting was up in 2019 with the Happy Fun Ball. We have to remember that 2019 was not merely a prolific hitting season, but a record-setting, off-the-charts power season. Take a look at the league-wide stats since 2015 to see just how much the power stats jump out:
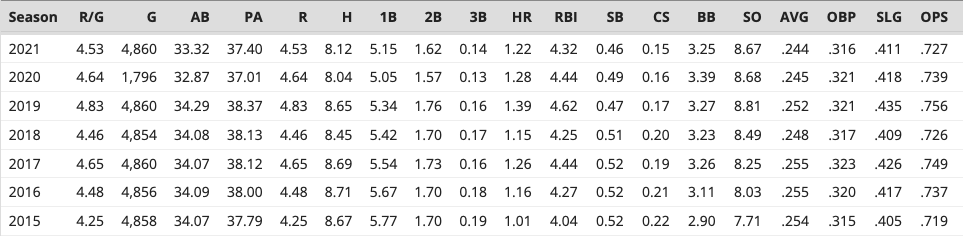
Keep in mind that the HR rate of 1.26 per team, per game in 2017 set a major league record, by a comfortable margin. 2019's 1.39 HR/G rate blew that out of the water. So while last season's 1.22 rate was a big drop from 2020 and a huge drop from 2019, it's still one of the highest rates of all time.
As with previous seasons, I'm going to list the 80th/70th/50th percentiles for each category in the NFBC Main Event, TGFBI, and the RotoWire Online Championship, but I'm going to eschew listing the 20th percentile. Nobody shoots for just getting the 20th percentile in a category, and if you're so inclined to dig for that information, it's available if you've played in any of those contests, under the "My Historical Teams" link under "My Teams." Why 80/70? Eighty percent is roughly what you need to average in each category to win your individual league, and 70 percent to cash.
How about winning the overall event - would you like to know what it took? No, after Phil Dussault's reign of terror last season, no you don't. Typically you need to average finishing in the 90th percentile in each category. Three years ago, John Pausma scored 4,588 out of possible 5,100 points, or 89.96% across the board. In 2019 Abdul Madani scored 5,335 out of 5,700 possible points, or 93.6%. James Tomony in 2020 scored 5,362.5 out of 5,700, or 94.08%. But Phil, The Robot, took it to another level last season by scoring 6,210.5 out of a possible 6,450 points, good for a whopping 96.29%! As a result, if you want to compete in the overall contest, you're going to have raise your targets accordingly. I don't think that's all that revolutionary to say.
Let's take a look at the hitting categories. This year I'm listing three seasons of data for the Main Event, TGFBI and the RotoWire Online Championship, 2021, 2019, and 2018.
Batting Average
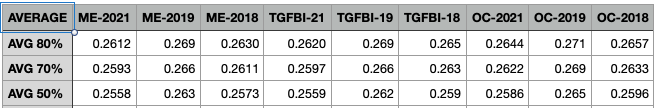
ME = NFBC Main Event
TGFBI = The Great Fantasy Baseball Invitational
OC = RotoWire Online Championship
Batting averages across the game have utterly collapsed, so it only follows that our batting average targets have similarly collapsed. The league-wide batting average in baseball was .244, the lowest it's been since 1972, and so far the nadir of a trend that's been building since the turn of the century. Strikeouts are way up, batting averages are way down, and power is significantly higher. Adjustments to the ball to cut down on power have not helped those hitting just for average, they've just made it harder for all batters to hit. If your team hit .263 in the Main Event in 2019, that was only good enough to put you in the middle of the pack. That same average would have put you at the 87th percentile last year.
We'll see what changes the new Collective Bargaining Agreement will bring to the play of the game, but I think it's going to be difficult to reverse this trend, or even if such an adjustment is deemed desirable. So many of the advancements in the game have benefitted pitchers - increases in velocity, perfection of the shift, etc... What's the next great advancement going to be to benefit hitters?
Runs
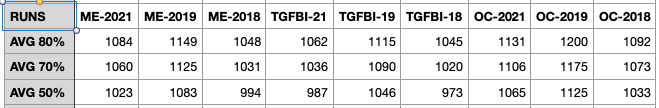
The cliff isn't as steep in terms of runs scored as it was in batting average, and you can see that's it really emphasizing the increase in scoring in 2019. Teams across MLB averaged 4.53 runs per game, closer to being in line with 2016 and 2018 results. To reach the 80th percentile in runs scored, you needed to average 77 runs per offensive slot in the Main Event, 76 per slot in TGFBI, and 81 runs per slot in the Online Championship.
Home Runs
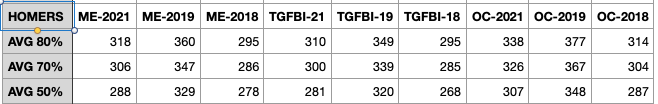
Happy Fun Ball is gone. Do not taunt Happy Fun Ball. Or ... is Happy Fun Ball really truly gone after all? (Sub required) Dr. Meredith Wills, an award-winning astrophysicist who has done tremendous research about MLB's adjustments to the ball over the last few years, found that MLB used two different types of baseballs during the 2021 season. Those two balls had wildly variant results, with one flying out of the ballpark at a rate more similar to the 2019 and 2020 seasons, and the other at a much lower rate. If you don't have a Business Insider account, you can still read a good summary of her report on BI's Twitter thread about the topic.
You can see how big of an impact that construction of the ball matters in figuring out how many homers we need to compete in the category. You can also see that the construction of the baseball is going to be as clear as the mud that they rub down those baseballs. If I had to hazard a guess, whenever we emerge from this owner-driven lockout, there's going to be an incentive to drive up offense to increase attention to the game on the field. I think we'll eventually have a universal DH and a springier baseball, similar to 2019. To that end, I'd expect to need more than the 23 homers per offensive slot (Main Event) that it took in 2021 to reach that 80th percentile.
RBI
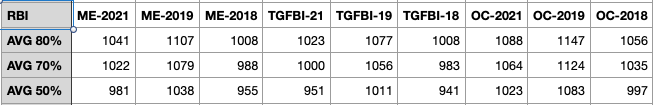
Runs Batted In track similarly to Runs scored. They were significantly lower in 2021 than in 2019, but ahead of 2018. To reach the 80th percentile in each contest, you needed 74, 73 and 78 RBI from each of the 14th offensive slots in one's roster respectively. Keep in mind when I'm stating "14 offensive slots," in all three contests an active roster requires two catcher slots, as was the case in most original rotisserie league formats. I realize that alternate versions of the game, including default rosters in Yahoo! leagues, don't require two catchers, or eliminate an outfield spot, or have two UT slots, etc ... Just try to adjust accordingly.
Stolen Bases
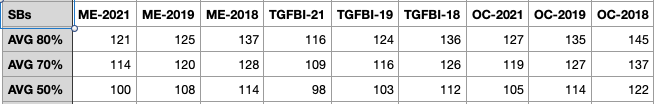
Stolen bases continue to disappear from the game, and we've seen a concurrent drop-off in the fantasy game. Teams averaged 0.46 stolen bases per game in 2021, the lowest stolen base rate since 1971. If fewer singles and more homers are hit, and if more batters are striking out, it follows that there are fewer players to attempt stolen bases, and that the cost of a caught stealing is higher than ever. Fewer players are running, and the top stolen base artists are running less often. Only 19 players had 20 or more stolen bases last year.
What does this all mean? It's increasingly difficult to find 20-20 guys (nine last year), let alone a 30-30 player (Cedric Mullins, that's the list), but you don't really need them. A batter that gets you 10-15 bags can make a huge impact. Not only do we need fewer bags to compete, but the category is more compact. Every marginal stolen base carries more heft. Not only should that shape our draft strategy, but it really makes finding the spare stolen bases on the waiver wire all that more important. If you timed the market correctly and picked up Nicky Lopez at the right time, kudos! You probably gained 4-5 points in your standings merely from that. Now ... I don't really think Nicky Lopez necessarily is a good value *this* year, but the point is, be aggressive on those SB waiver wire pickups.
As always with targets, use these as a loose framework for your draft goals. Player projections are a notoriously volatile exercise even before figuring out the batted ball environment for the season. Injuries and subsequent IL trips are playing a bigger role than ever. You might come out of a draft thinking you've sufficiently covered power or speed, but chances are reality will throw you a curveball most often seen on Pitching Ninja.
Speaking of pitching, I'll be back with pitching targets in the next week to 10 days. Good luck in your draft prep!